Cardinality Explosion
In terms of Observability (O11y), a Cardinality Explosion occurs when a metric or combination of metrics generates an excessive number of custom metrics. Excessive metrics increase cost, strain resources, and can impact system responsiveness.
Key terms:
- O11y - Shorthand for observability
- Data Dimension - Tracked metric for an application
- Cardinality - The number of tag values associated with a tag key for a metric
- Tag - Combination of metrics; sometimes called a label in O11y products
Datadog custom metrics and billing
If a metric is not submitted from a Datadog integration, it’s considered a custom metric. A custom metric is identified by a unique combination of a metric’s name and tag values (including the host tag). In general, metrics sent using DogStatsD or through a custom Agent Check are considered custom metrics.
Warning
Your count of custom metrics scales with the most granular or detailed tag. Extremely granular custom metrics increase Datadog billing charges.
Example
You have a number_of_employees metric that counts the number of employees in an organization. This metric has department and region tags.
These tags are considered low cardinality because of the broad nature of their classification. If you add an extremely granular tag, such as employee_id, to that same metric,
the metric cardinality becomes unbounded and results in a Cardinality Explosion. Because of the high cardinality of the employee_id tag, Datadog billing for custom metrics increases.
For more examples, see the Custom metrics billing topic from Datadog.
Best practices for custom metrics within Datadog
Mitigate or avoid high cardinality metrics:
-
Roll-up attributes - Narrow high cardinality metrics to a broader category.
-
Remove unnecessary metrics - Remove metrics that do not add value.
Tip
If your dashboard tracks so many metrics that it's hard to use, you probably have too much cardinality.
-
Monitor - Have a monitoring system in place that scans for metrics showing a significant increase in total labels.
-
Avoid metrics that can grow without bounds - Don't use metrics if you can't strictly limit the unique values, such as user IDs, IP addresses, or user input. Instead, record these by logging.
-
Be mindful when adding new metrics - Multiply your existing labels by the number of known values for a metric to determine whether it will significantly increase the label count.
Datadog's Metrics without Limits
Datadog has a feature for managing tracked metrics, which is available on the Metrics Summary page.
-
Tagging metrics
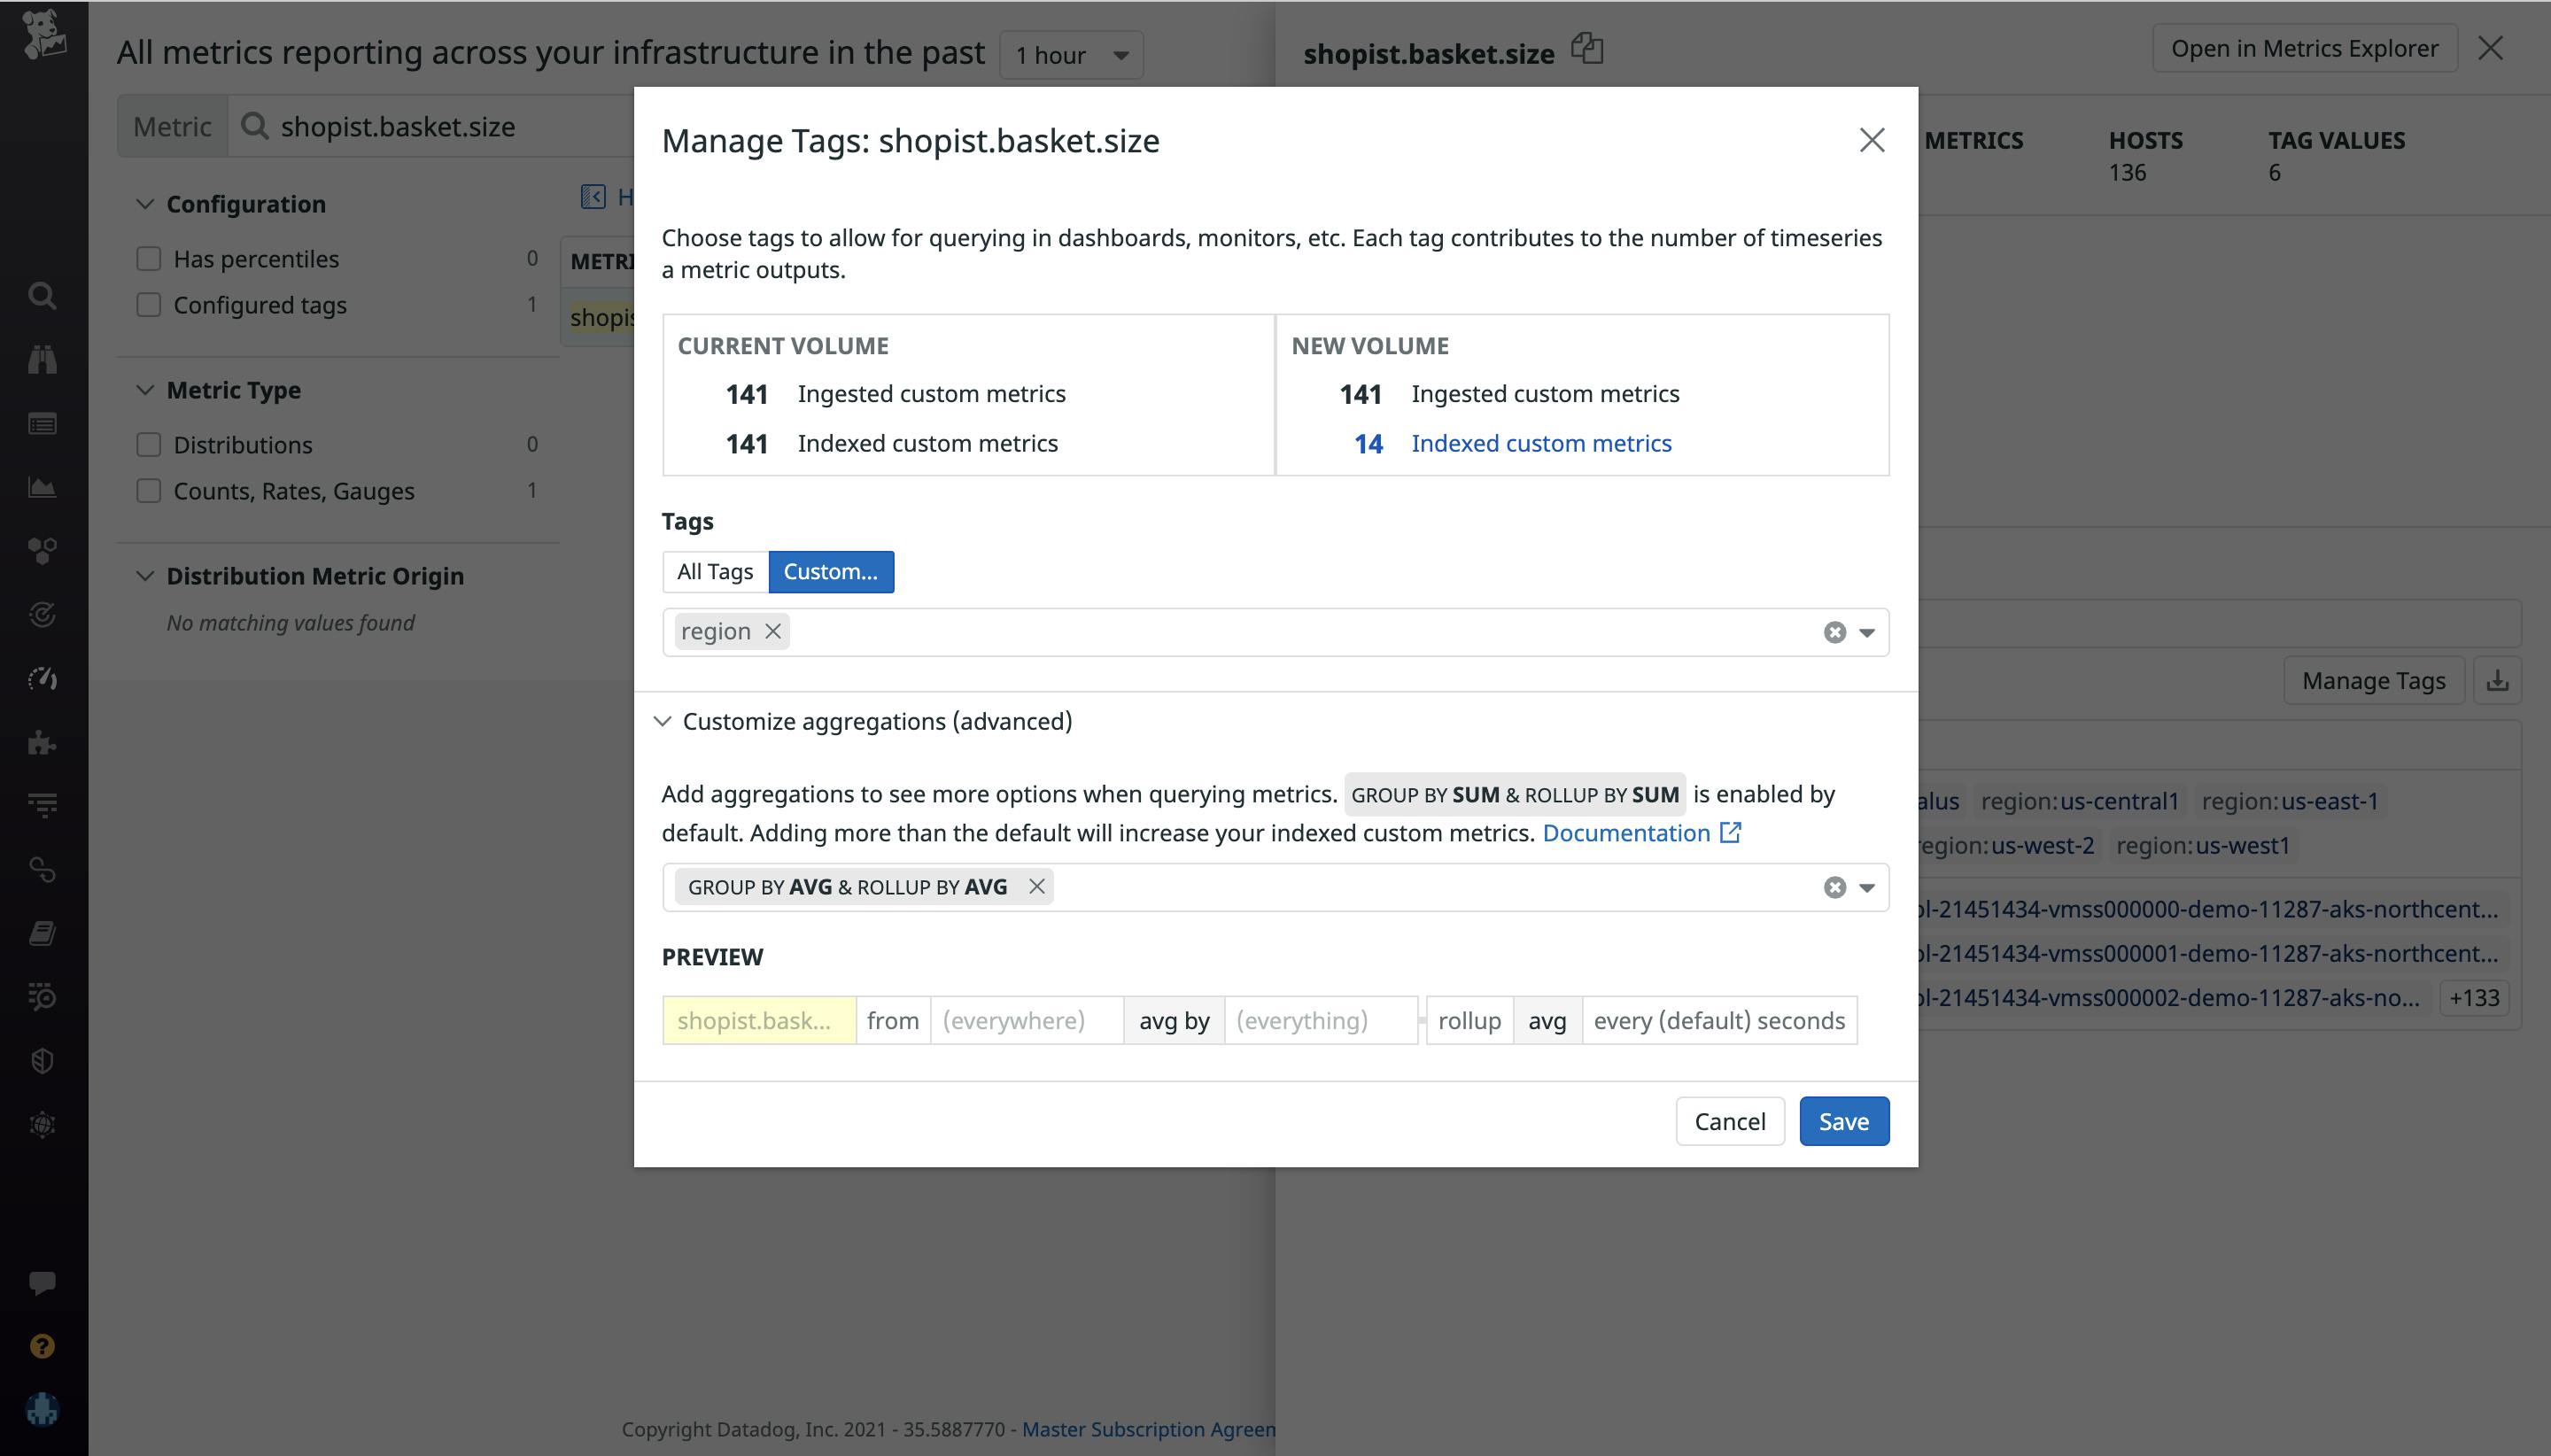
This functions as a roll-up mitigation strategy and allows you to group metrics and treat them as a single item. Default behavior is to
GROUP BY SUM&ROLLUP BY SUM.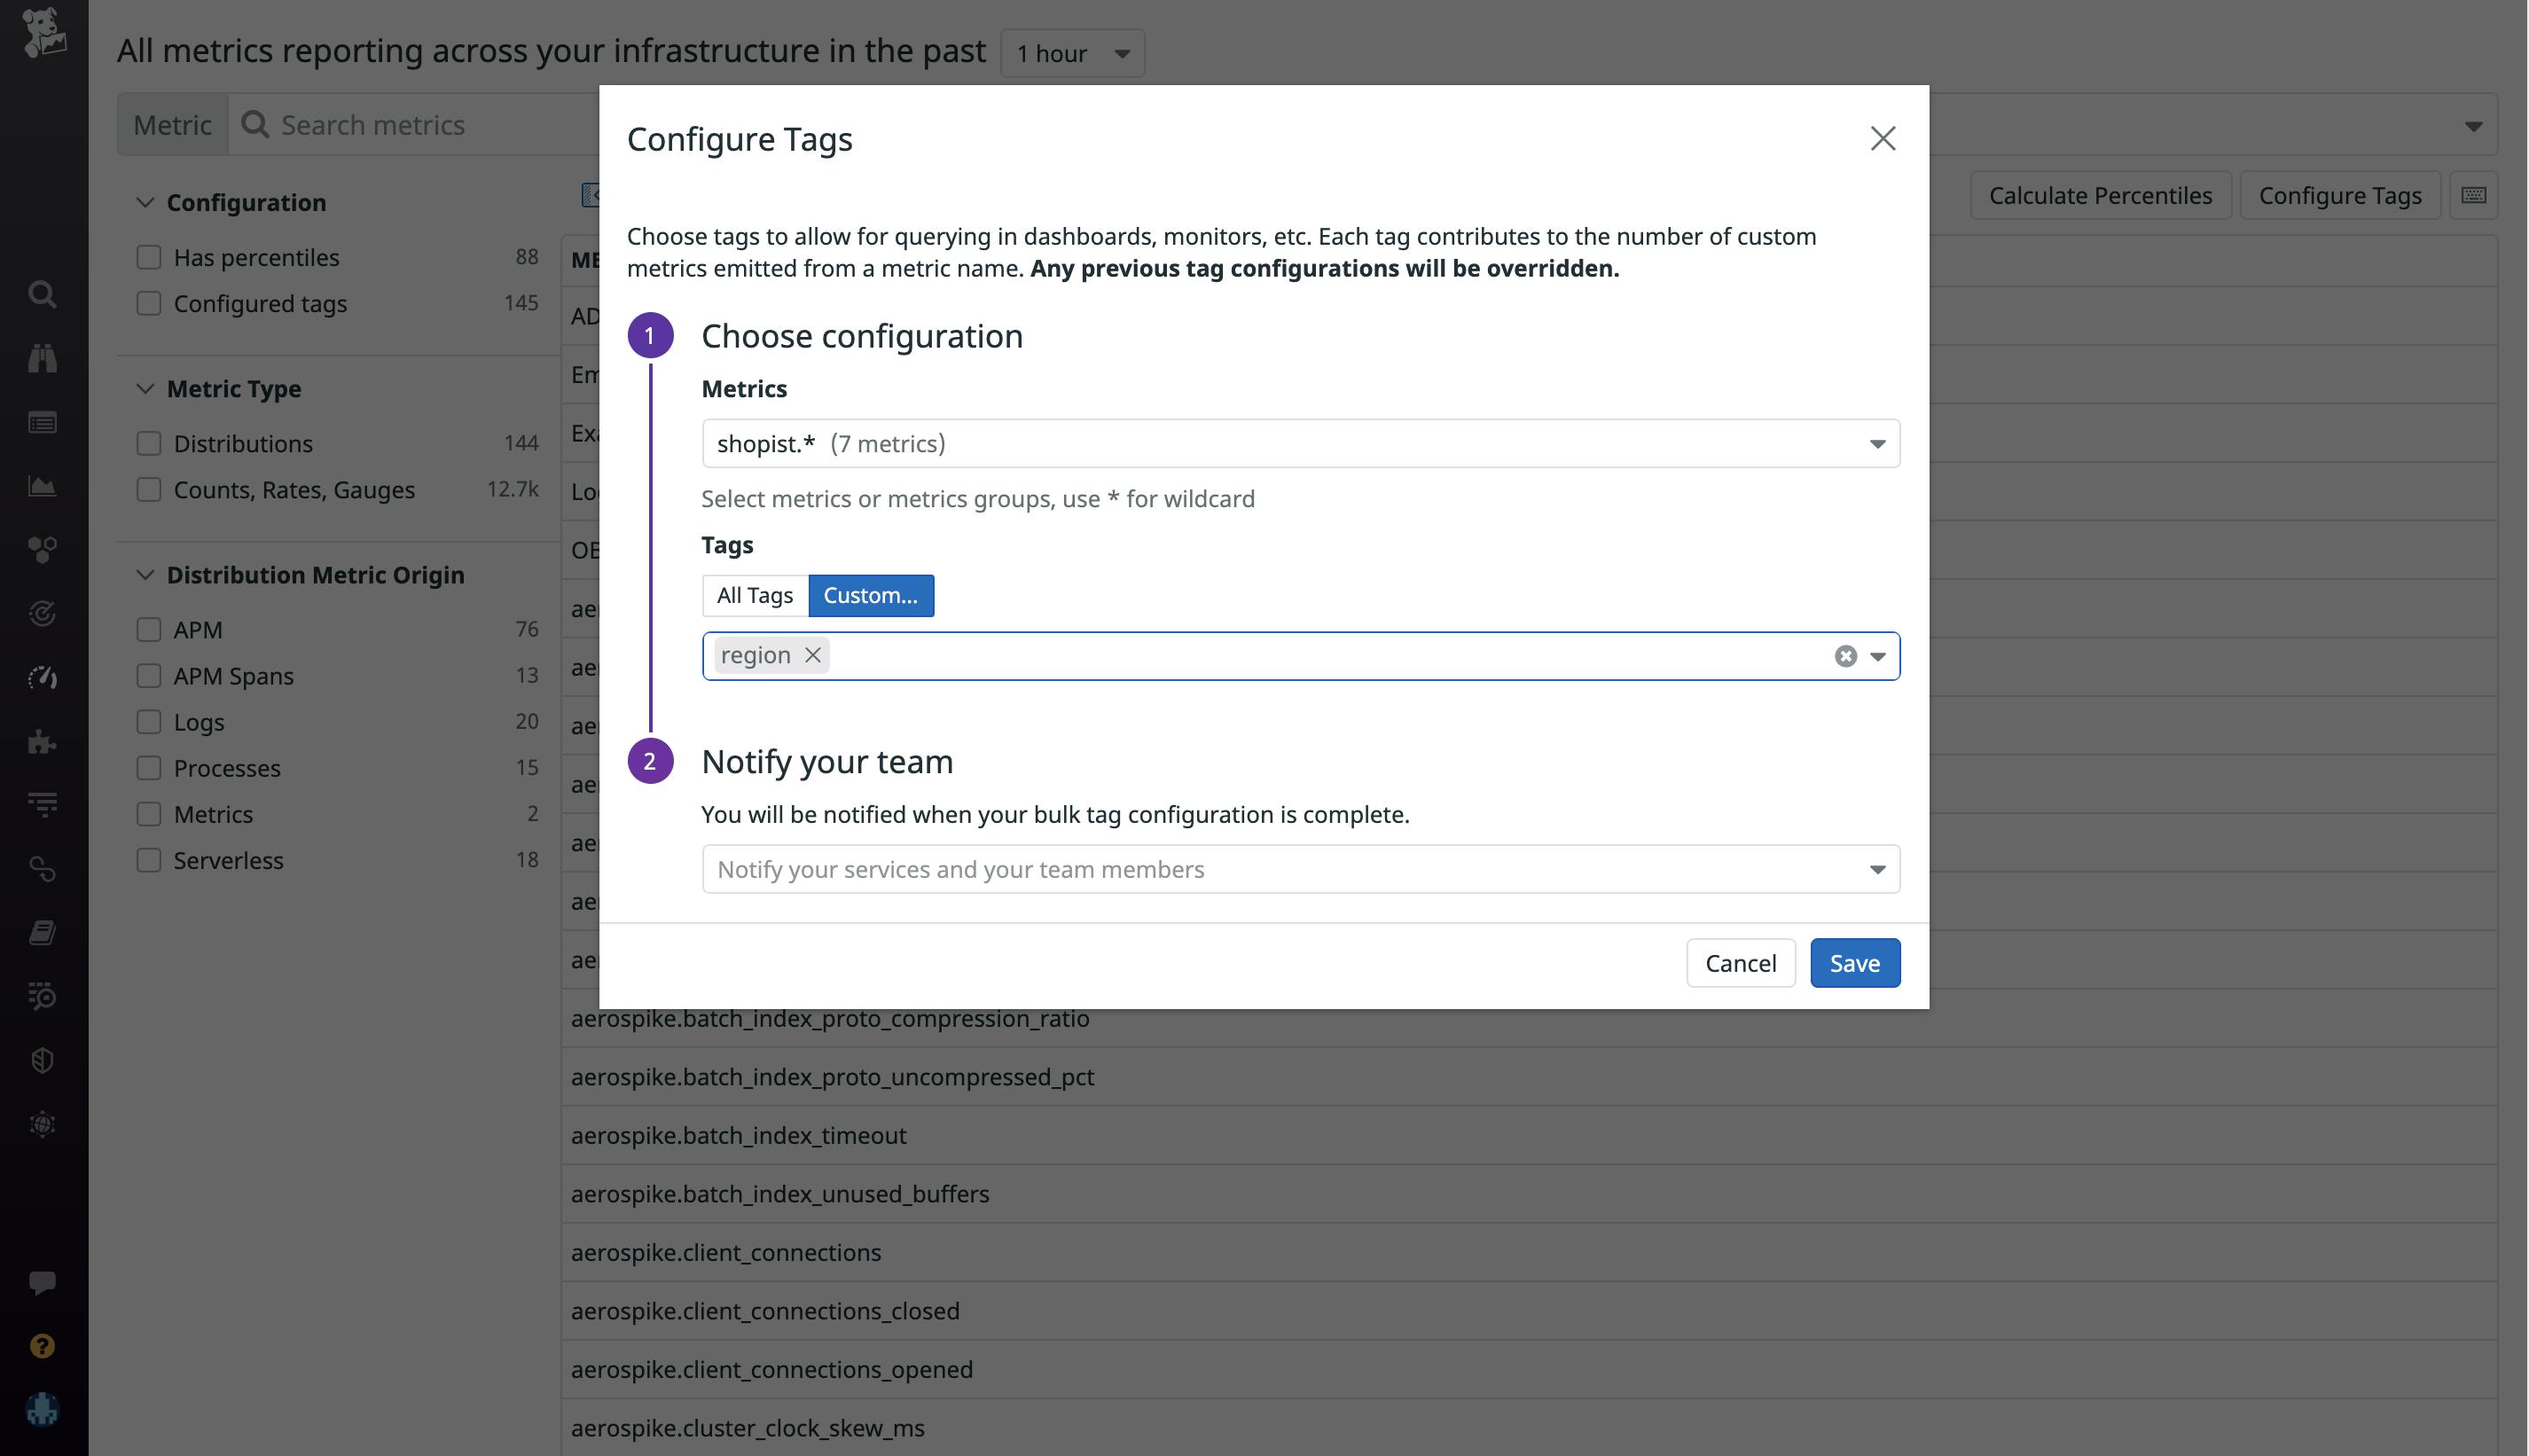
-
Retrieval of previously tagged metrics
If it becomes important to view a metric that was previously modified by tagging, it can be reindexed in the Manage Tags window.

-
Limit metrics using the Datadog Agent
The Datadog Agent can be supplied with a configuration file to modify tracked metrics before submitting to Datadog. See the Datadog documentation for more information.
-
Be mindful of "Generate New Metric"
The Logs view and Traces view each have a Generate New Metric button. This has the same implication as adding a new custom metric in an application based on your current search parameters, including billing as custom metrics. You can create Custom Analytics within the Analytics view. This is useful for temporary issues that you'll use only for a short term, like days to weeks.
Cardinality explosion scenarios
Various combinations of metrics can multiply exponentially and lead to two scenarios that cause a Cardinality Explosion.
Scenario 1: Single High Cardinality Data Dimension
2 servers running 2 applications with 4 different status codes (low cardinality metrics)
Multiply together for possible combinations:
2 (servers) x 2 (applications) x 4 (status codes) = 16 possible tags for your O11y application to track
Now track each user's metrics individually, with a user base of 100 unique individuals (high cardinality metric)
2 (servers) x 2 (applications) x 4 (status codes) x 100 (users) = 1600 possible tags
One high cardinality metric added 1584 new tags to the O11y application.
Now increase the user base from 100 to 10,000 because our application launched in a new region
2 (servers) x 2 (applications) x 4 (status codes) x 10000 (users) = 160,000 possible tags
Then increase the number of servers from 2 to 8 to accommodate the load from new users
8 (servers) x 2 applications x 4 status codes x 10000 users = 640,000 possible tags
The O11y application must now track 640,000 possible tags
Scenario 2: Excessive Number of Low Cardinality Data Dimensions
2 servers running 2 applications with 4 status codes
2 (servers) x 2 (applications) x 4 (status codes) = 16 possible tags for your O11y application to track
Now add a metric that tracks which endpoints are being hit (5 endpoints) and which of 5 feature toggles are active. (Toggles a, b, c, d, and e, which are boolean values.)
2 x 2 x 4 x 5 (endpoints) x 2 (toggle a) x 2 (toggle b) x 2 (toggle c) x 2 (toggle d) x 2 (toggle e) = 2560 tags
The boolean values alone added a multiplier of 2^5 to the total number of tags
Additional resources